
The ATS metrics worth a small team's time are time in stage, response time, stage conversion, time to fill and a short quality-of-hire list. Most ATSs record the first four from timestamps. Quality of hire and offer decline reasons need a person to type them in. At about 10 hires a year, read names and counts before percentages.
By Dev Rishi Khare, former machine learning engineer at Amazon (search and recommendations) and Synopsys
You open the reports page in your ATS and there are more charts than open roles. Most of them describe activity, and very few tell you whether a hire is about to slip. This guide sorts the numbers into the ones your system already records, the ones that only exist if somebody writes them down, and the ones to stop looking at.
The rules of thumb here are Dev's view, not measured data. For a broader primer on the subject, see what recruitment analytics covers.
Metrics most ATSs record automatically
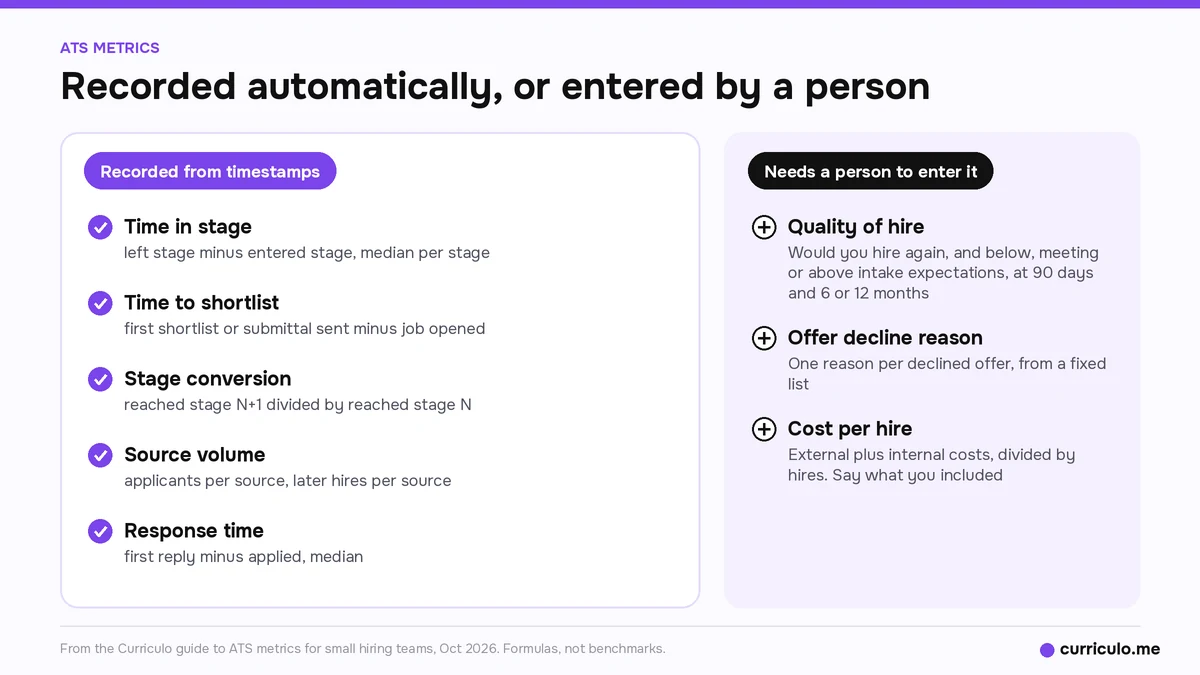
Most ATSs stamp a date and time whenever a candidate applies, moves stage or gets a reply. That's enough to calculate these five without extra work.
| Metric | Formula | How to read it |
|---|---|---|
| Time in stage | Date the candidate left the stage minus the date they entered it | Use the median per stage, not the average |
| Time to shortlist | Date the first shortlist or submittal went out minus the date the job opened | One number per role |
| Stage conversion | Candidates who reached stage N+1 divided by candidates who reached stage N | Per role or per quarter |
| Source volume | Applicants per source, and later, hires per source | Volume alone says little about fit |
| Response time | Date of first reply minus date applied | Median, plus the share answered within 2 business days |
Time in stage is the one that catches problems early. If candidates sit in "hiring manager review" for over a week while every other stage moves in a day or two, you know where the role is stuck before anyone complains.
Stage conversion overlaps with the question of how many candidates you interview per hire, which has its own guide with sourced benchmarks. At small volume, read conversion per quarter, because a single role rarely has enough candidates to say much.
Source volume is also where a tool change shows up first. If applicants per role fell the month you moved systems, work through the checks in why applications drop after switching ATS before you read anything into the trend.
Metrics that need a person's input
No timestamp tells you whether a hire worked out or why an offer was turned down. These three only exist if someone records them.
Quality of hire
Dev's advice is to keep this simple. At 90 days, and again at 6 or 12 months, ask the hiring manager two questions:
- Would you hire this person again, yes or no?
- Are they below, meeting or above the expectations set at intake?
Add whether the person is still there at 90 days and at 12 months. Keep one row per hire and read the list, because a percentage built on eight rows hides more than it shows. If you're an agency, use the client's answer, and note whether that client came back with another role.
Offer decline reasons
Give every declined offer exactly one reason from a fixed list: pay, counteroffer, another offer, location or remote policy, role scope, process too slow, or other. A fixed list matters more than the exact wording. Free-text reasons can't be counted, and by the third decline nobody remembers what the first one said.
Cost per hire
The formula is external costs plus internal costs, divided by hires. External costs are ads, sponsored posts, agency fees and tools. Internal costs, such as recruiter and interviewer time, are optional, as long as you say what you included.
A reply in an r/smallbusiness thread, Hiring platforms? Do you use indeed?, puts the better version in one line: "Track cost per qualified interview rather than cost per application."
Time to hire versus time to fill
People use these two interchangeably, and they measure different things.
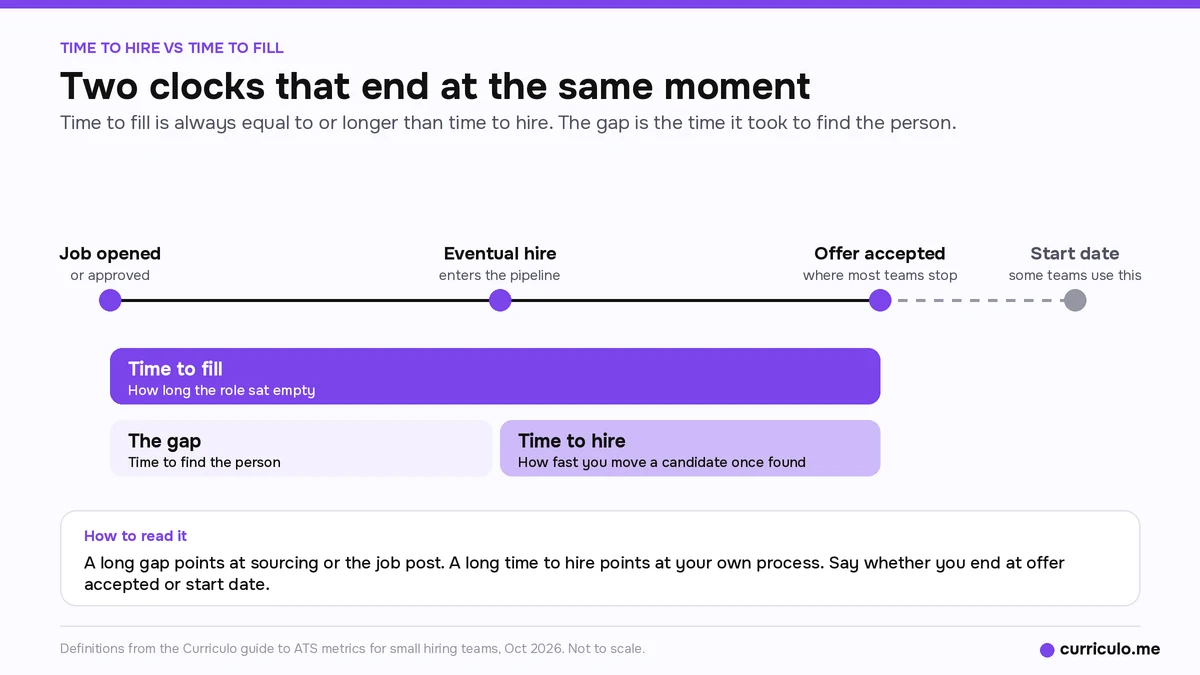
Time to hire runs from the day your eventual hire entered the pipeline to the day they accepted the offer. It tells you how fast you move a candidate once you've found them.
Time to fill runs from the day the job opened or was approved to the day the offer was accepted. Some teams end it at the start date instead, so say which one you use. It tells you how long the role sat empty.
Time to fill is always equal to or longer than time to hire. The gap between them is the time it took to find the person. A long gap points at sourcing or the job post, while a long time to hire points at your own process. If you want outside numbers to compare against, see time to hire benchmarks for 2026, and read them with the warning in the next section.
Why percentages mislead at 10 hires a year
At about 10 hires a year, any percentage built on single digits swings hard on one person. Offer acceptance, 90-day retention and source of hire can each move 10 to 20 points because of a single candidate.
Illustration, not data
Say 9 of last year's 10 hires were still there at 90 days, and this year it's 8 of 10. That reads as 90% falling to 80%, a 10-percentage-point drop, or about 11% in relative terms. The difference is one person. Look at why that person left before you change anything.
Averages have the same weakness. One slow executive search can drag a mean time to fill up by weeks, so use the median or list every hire with its dates. Big-company benchmarks are a poor comparison too. Against them, you can look slow when you're fine, or look fine while a faster competitor takes your candidates.
Dev's advice at this volume: track counts and a list of every hire with dates, and read trends over 6 to 12 months instead of month to month.
A five-number dashboard for about 10 hires a year
If you want a recruiting metrics dashboard that fits on one screen, Dev suggests these five numbers.
- Open roles, plus how many have been open for 30 or more days and for 60 or more days.
- Median days to first reply over the last 30 days.
- First interviews (or submittals) per hire, rolling 12 months.
- Median time to fill, rolling 12 months, with each hire listed underneath.
- A quality-of-hire list: every hire in the last 12 months, with the 90-day would-hire-again answer and whether they're still there.
How Dev suggests reading it once a month:
- Compare with the rolling 12 months, not with last month.
- Read the list behind each number, since one slow search or one early leaver usually explains a swing.
- Act only on a pattern, such as three months moving the same way or the same decline reason twice.
- Take one action a month at most, and check it the next month.
Ignore month-over-month percentage changes entirely at this size.
The weekly client report for agencies
If you recruit for clients, your report is a different document from your own dashboard. Dev's suggested version is one screen per role:
- Candidates per stage, who's in front of the client now, and the next step for each.
- Days waiting on client feedback, named per candidate.
- One line on the market, such as pay pushback, competing offers or a thin talent pool.
- Decisions the client needs to make, with dates.
Some things stay internal. Your full sourcing funnel and outreach numbers stay off the report, and so does everyone you screened out and why, because the client gets the shortlist. Pay expectations wait until they matter for an offer. Other clients or roles a candidate is in, and your own conversion rates, stay internal too. Dev's reasoning is that the client buys outcomes, not an activity log.
When the founder is the recruiter
Founders who hire alongside their day job need three habits more than any metric, in Dev's view:
- Every candidate in one place, with their stage and the date they were last touched.
- A one-line reason for every decision, including rejections, advances and declined offers.
- Fifteen minutes a month on open roles, days to first reply, and the list of hires and declines.
That one-line reason also keeps your rejection emails honest, which the guide on how to reject applicants without ghosting anyone covers stage by stage.
A spreadsheet is fine for one role with fewer than about 30 to 50 applicants. Dev's signal to move to an ATS is any one of these:
- More than one role open.
- Inbound you can't answer within 2 business days.
- More than one person touching candidates, such as a co-founder or an agency.
- The first time you lose track of someone.
The real reason to switch is that candidates stop falling through the cracks between Gmail and the sheet. The metrics come as a by-product.
A common mistake is never writing down why a candidate declined, was rejected or stalled. Without those reasons, the numbers later have nothing to explain them.
If you're at that point, Curriculo ATS Starter is free forever, with unlimited jobs and team members, and ranks up to 1,000 candidates. Pro is $50/mo early-bird (50% off the $100 list price) and ranks up to 10,000, with no per-seat fees on any plan. Curriculo ATS scores every candidate from 0 to 100 against your job, with a written AI summary of the fit.
What to stop tracking
Dev's first cut is cost per hire for a small team with no real ad or agency spend. The number ends up built on guessed time estimates and a handful of hires, and it nudges you toward the lowest-cost option over the fast or good one. His runner-up is applicants per role as a measure of success, because it rewards noise.
His contrarian point: at small volume, a list beats a dashboard. Ten names with dates, source, why they accepted and how they're doing at 90 days will tell you more than any chart. You earn the right to rates once you have the volume to support them.
Frequently asked questions
What are the most important ATS metrics for a small team?
Time in stage, response time, stage conversion, time to fill and a quality-of-hire list. Most ATSs record the first four from timestamps. Quality of hire needs a manager's answer at 90 days and again at 6 or 12 months.
What's the difference between time to hire and time to fill?
Time to hire starts when your eventual hire entered the pipeline. Time to fill starts when the job opened or was approved. Both usually end at offer acceptance, and time to fill is always the same or longer.
Which ATS metrics can't be recorded automatically?
Quality of hire, offer decline reasons and the internal side of cost per hire. They need a person to enter an answer, ideally from a fixed list, so they can be counted later.
How do I read recruiting metrics with only 10 hires a year?
Dev's advice is to use counts, medians and a list of every hire with dates. Compare against the rolling 12 months and read trends over 6 to 12 months. A move from 9 of 10 to 8 of 10 is one person, so check why before changing anything.
Which ATS reports stage conversion and dropout reasons?
Most ATSs record stage moves with timestamps, so stage conversion is usually available. Dropout and decline reasons usually depend on your team picking a reason from a fixed list each time, so check that the field exists and that people fill it in.
More recruiting metrics and hiring guides are on the Curriculo ATS blog.